
Prasanna Kumar, CEO of B&B, a top rated microbrewery pub in Bangalore, is young, aggressive, energetic and loves to take decisions based on data. It would be apt to say that he is quite paranoid about it over the last 6 months and that puts us under a lot of pressure, being his software partner for BOH operations. Personally, am quite happy to work with such owners, as they are the ones who look to stay ahead of the curve by leveraging technology to the fullest. It also helps improve our product to keep up with their increasing expectations. We work very closely with him and this monologue will give insights into how one can turn things around when there is a will. He has been gracious enough to allow me to publish the actual data and the turn around effort that went in.
Background
B&B uses EagleOwl for backend operations (BOH) and we integrate with their POS vendor for itemised sales data import. Unlike what most perceive, a brewery isn’t a very high margin business due to complexity of operations, licensing costs, interferences from government authorities and other ‘miscelleneous or convenience’ expenses. Competition in the market is very high with numerous breweries opening up in Bangalore and sales is pretty much flat or at best a 1-3% increase year on year. The operational expenses (wages, electricity, rent, licence renewals, etc) keep increasing and it is not easy to maintain the desired margin.
In June’19, Prasanna revamped the entire menu and wanted to get very deep into controlling costs. He was also looking to recruit a cost controller for his brewery and I interviewed a few candidates on his behalf. He was dissatisfied with the quality of people who turned up and decided not to pursue that path. Subsequently, he signed us up for maintaining system hygiene and weekly reporting, apart from subscription costs for the software. He echoed, “Am not quite sure if these controllers are worth it, looks like I need to teach them. I would be better off using you for analytics and costing. Either way I need to pay him and might as well pay you the same.”
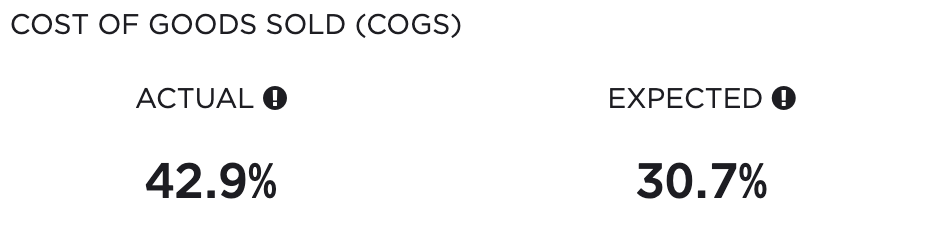
In June, his food cost was 42.9%, which is egregious and unprofitable for any restaurant. Sales on food was quite healthy, consistent with most breweries and his projected monthly sales. However, expected COGS was 31% translating roughly into INR 7,00,000 (~USD 10,000) more than expected spend on purchases to cover the sales.
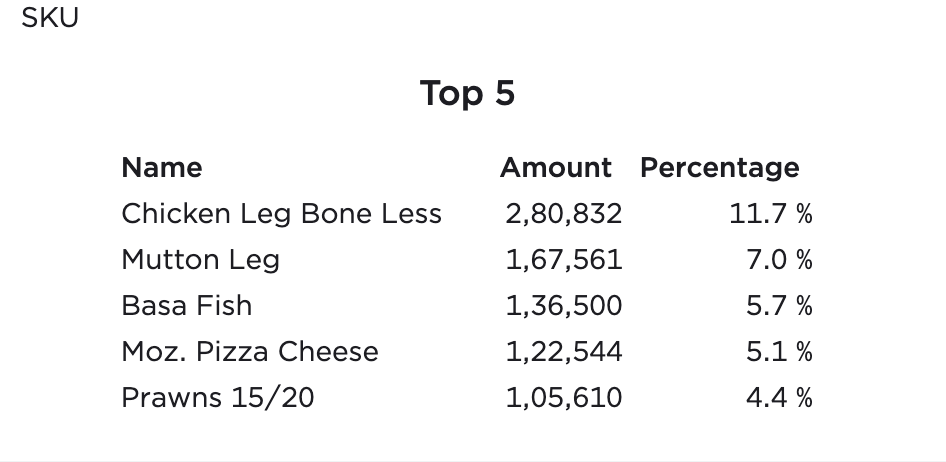
The system hygiene was well set by June, all recipes were in, linked to menu and this gave us enough to start looking into the variance. Prasanna pulled up his team and gave a mandate that he needs to see this at 32% in July. Like a hawk, he was monitoring food cost trend every single day. We started by looking into top SKU consumptions for the month.
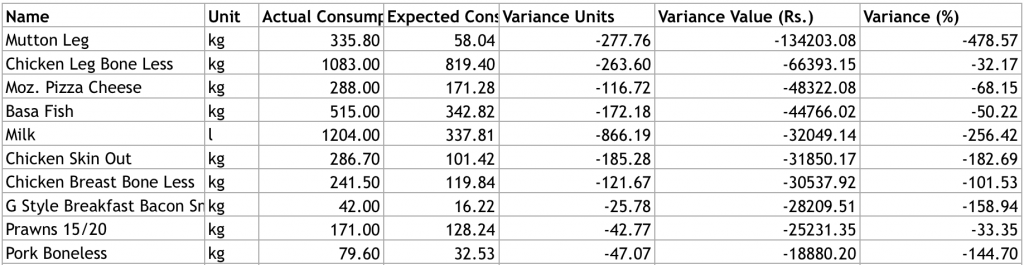
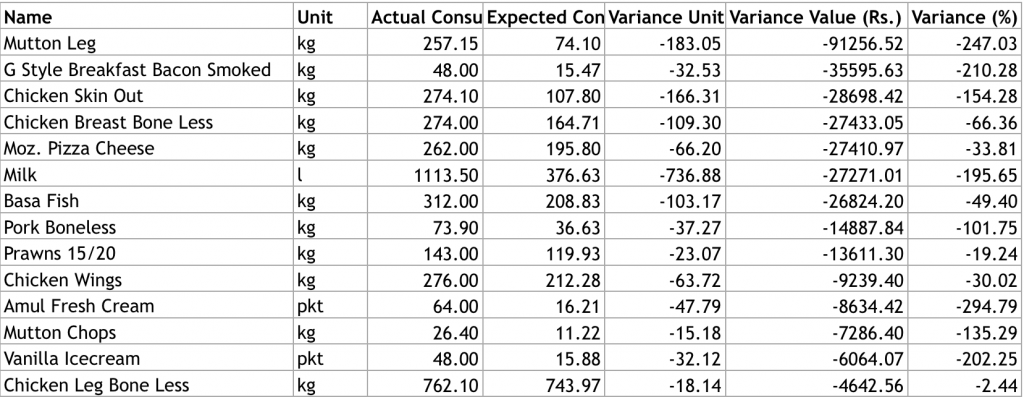
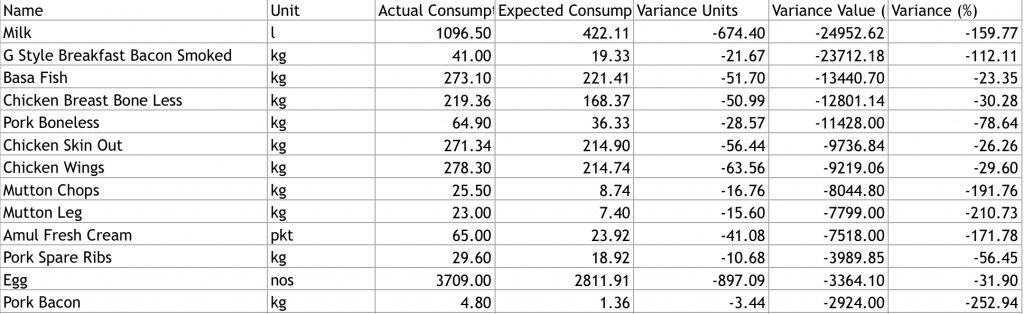
Top 10 SKU Variances – June
As we can see, the top consumed SKUs, expectedly, stand out in variance chart. The top 10 items under Dairy and Meat category contribute to a variance of INR 4,60,000 (USD 6500) in negative variance. Our plan was to track some of these SKUs to bring down consumption, in accordance with expected levels.
What then happened – July
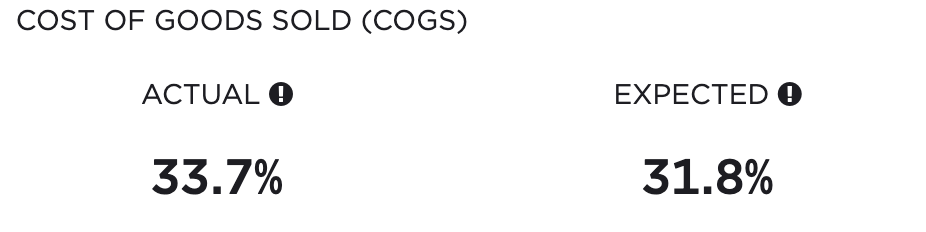
Chef started recording frequent closing stocks for some of the SKUs and tracked daily variance based on the previous day sales. This happened regularly in July. As the menu was frozen in June, we didn’t have any new variables. Sales for July under food category actually increased by 3%, but purchase decreased by about 19%. COGS reduced by 9.2%.
As we can see, nearly all top SKU consumption dropped compared to June, even though sale was higher.
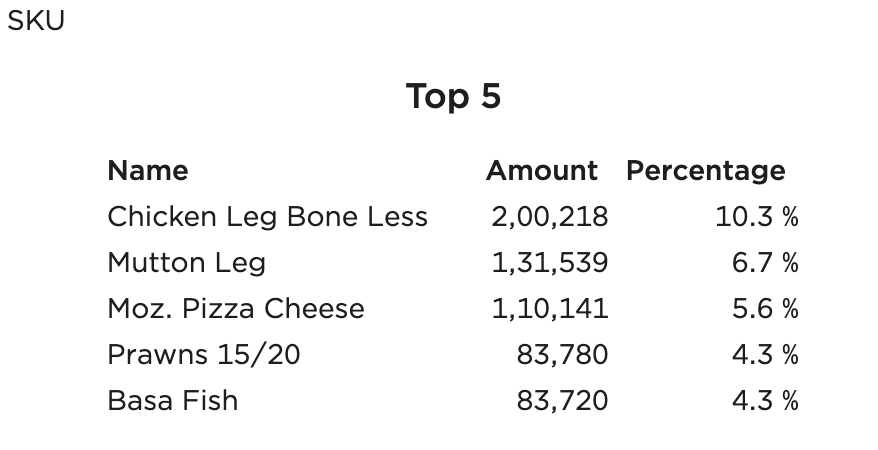
Now, this is how the chart looked in July – Chicken leg bone less dropped down to 14th place from 2nd. Here’s the top 14 variances for July. Now, the interesting bit here is how the actual vs expected consumption nearly matches for Chicken Leg boneless which was one of our focus SKUs, just 2% variance, which is definitely acceptable, compared to 32% the previous month.
Now, there is still more work to do. Mutton Leg, Mozzarella, and Basa, plus we need to ensure the target items stay as it is and we bring down COGS even further in August. We didn’t yet achieve our target below 32%. There was more than double effort of multiple physical stock taking in Aug (Orange), compared to July.


August SKU consumption
Hurray – We finally got there. Look how close the expected vs actual consumption is. And in August, food sales was roughly 10% more than June. And purchase cost dropped by 26% compared to June, and 8.7% from July.
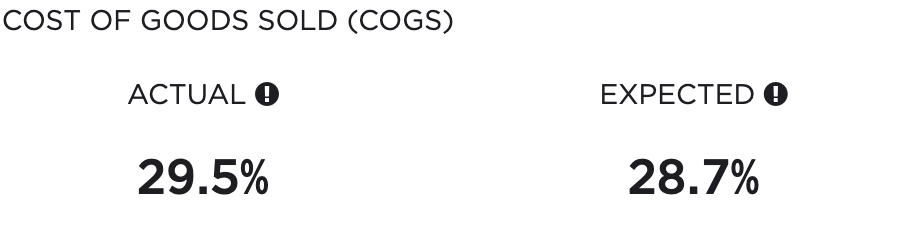
Okay, how are we doing on variance – is Chicken doing fine? Absolutely. In fact it turned from showing a -ve variance to +ve variance.

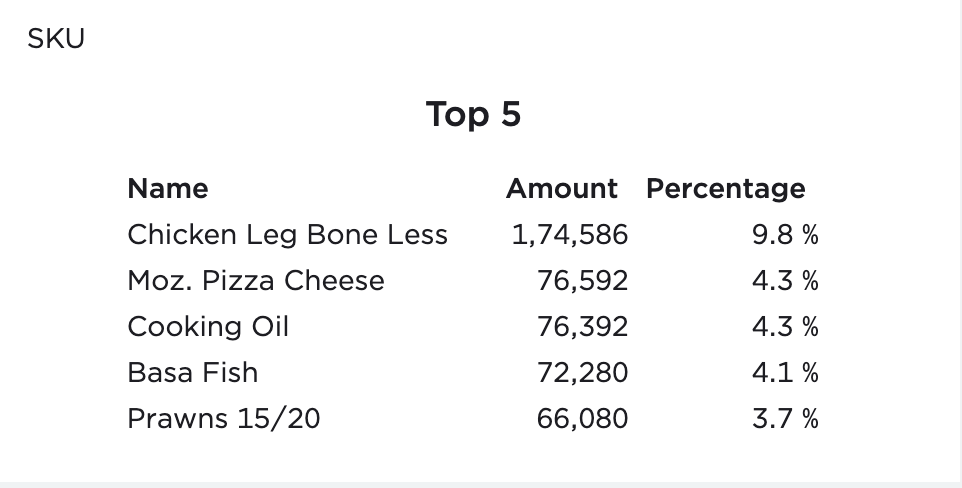
Now, let us relook at out top 14 for August. Mutton drops down, Basa shows less variance compared to July, Prawns is not even in the picture.
So what happened with Prawns. Not bad, 1.6% variance.

In fact, this diligent effort helped us find a bug in variance report, which Chef Nuthan raised. The expected consumption for Chicken in July for a day was showing much lower than it should have been. Our recipes can be linked with multiple menu items, with differing selling prices and portions. We found a bug where if a recipe was linked to multiple menu items, it picked only one that was set by default and ignored the consumption for others. This was quickly taken care of.
Their effort didn’t stop here and continues till date, became a daily habit. More frequent stock takings on items and new items to focus every month, whilst keeping top consumption items in check. Every transformation takes time and it is up to the restaurant owner and his team to drive efficiency. This organisation is set for process and data oriented approach, than blindly doing issue based costing.
Entire staff is trained well enough to track metrics that matter. All of this was possible due to their sincere efforts in identifying the problem, figuring where the leakage is and to control it. It is tough work, but that’s what it takes. After all, who wouldn’t want to save 5-6 lakhs a month on procurement costs and ensure COGS is reasonable and aligned within expected range?
September physical stock dates for select SKUs – Transformation is on.

As they say in poker, “Money saved is money earned”.